Ohio's 10th congressional district
Appearance
(Redirected from Election Results, United States Representative from Ohio, 10th District)
| Ohio's 10th congressional district | |
|---|---|
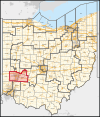
Interactive map of district boundaries since January 3, 2023 | |
| Representative | |
| Population (2023) | 784,462[1] |
| Median household income | $64,305[2] |
| Ethnicity |
|
| Cook PVI | R+4[3] |
Ohio's 10th congressional district is represented by Representative Mike Turner (R). The district is based in southwestern Ohio and consists of Montgomery County, Greene County, and a portion of Clark County.The cities of Dayton, Centerville, Xenia, and Springfield are part of the district.[4]
Election results from statewide races
[edit]| Year | Office | Result |
|---|---|---|
| 2000 | President | Al Gore 53% - George W. Bush 42% |
| 2004 | President | John Kerry 58% - George W. Bush 41% |
| 2008 | President | Barack Obama 59% - John McCain 39% |
| 2012 | President | Mitt Romney 50% - Barack Obama 48% |
| 2016 | President | Donald Trump 51% - Hillary Clinton 44% |
| 2020 | President | Donald Trump 51% - Joe Biden 47% |
Composition
[edit]| # | County | Seat | Population |
|---|---|---|---|
| 23 | Clark | Springfield | 134,610 |
| 57 | Greene | Xenia | 169,691 |
| 113 | Montgomery | Dayton | 533,796 |
Cities and CDPs with 10,000 or more people
[edit]- Dayton – 135,512
- Springfield – 58,662
- Kettering – 57,862
- Beavercreek – 47,193
- Huber Heights – 43,439
- Fairborn – 34,729
- Centerville – 25,754
- Xenia – 25,441
- Riverside – 24,474
- Trotwood – 23,070
- Miamisburg – 19,923
- Springboro – 19,062
- Vandalia – 15,209
- Englewood – 13,249
- Clayton – 13,222
- West Carrollton – 13,129
2,500 – 10,000 people
[edit]- Oakwood – 9,572
- Bellbrook – 7,409
- Union – 6,859
- Moraine – 6,393
- Brookville – 5,918
- Germantown – 5,809
- Carlisle – 5,740
- Cedarville – 4,250
- New Lebanon – 3,796
- Yellow Springs – 3,697
- Fort McKinley – 3,473
List of members representing the district
[edit]Recent election results
[edit]The following chart shows historic election results. Bold type indicates victor. Italic type indicates incumbent.
Recent statewide election results
[edit]Results under current lines (since 2023)[7]
| Year | Office | Results |
|---|---|---|
| 2016 | President | Donald Trump 50.7% - Hillary Clinton 44.6% |
| Senate | Rob Portman 59.6% - Ted Strickland 36.1% | |
| 2018 | Senate | Sherrod Brown 53.4% - Jim Renacci 46.6% |
| Governor | Mike Dewine 51.7% - Richard Cordray 45.3% | |
| 2020 | President | Donald Trump 50.9%- Joe Biden 47.4% |
Historical district boundaries
[edit]
2003–2013

2013–2023
See also
[edit]- Ohio's 10th congressional district Democratic primary election 2008
- Ohio's congressional districts
- List of United States congressional districts
References
[edit]- ^ Bureau, Center for New Media & Promotion (CNMP), US Census. "My Congressional District". www.census.gov.
{{cite web}}:|last=has generic name (help)CS1 maint: multiple names: authors list (link) - ^ "My Congressional District".
- ^ "2022 Cook PVI: District Map and List". Cook Political Report. July 12, 2022. Retrieved January 10, 2023.
- ^ "Representative Michael R. Turner". Congress.gov.
- ^ Federal Elections 2008. Federal Elections Commission, Washington DC, July 2009
- ^ "2012 Election Results". Ohio Secretary of State.
- ^ "2022 Cook PVI: District Map and List". Cook Political Report. July 12, 2022. Retrieved January 22, 2023.
- Martis, Kenneth C. (1989). The Historical Atlas of Political Parties in the United States Congress. New York: Macmillan Publishing Company.
- Martis, Kenneth C. (1982). The Historical Atlas of United States Congressional Districts. New York: Macmillan Publishing Company.
- Congressional Biographical Directory of the United States 1774–present

